Market Intelligence / Data Analysis / Machine Learning
How We Value Klang Valley Industrial Property: Our Method (23,808 Deals)
Every figure in this series traces back to one place: a dataset of real deals and a valuation model built on top of it. This is the method — written so you can judge the reasoning, not just trust the conclusions. If a number elsewhere in the series surprised you, this is where you check our work.
The data
- 23,808 transacted commercial and industrial deals across Kuala Lumpur and Selangor, April 2021 – September 2025, sourced from NAPIC's Open Transaction Data — the official registry published by Malaysia's Valuation and Property Services Department (JPPH).
- Transacted prices recorded at the point of sale — not asking prices, not sentiment.
- Each deal carries property type, district and mukim, land and floor area, tenure, and transaction date.
- We geocoded each property and engineered location features — distance to the KL city centre, KL Sentral, Port Klang, KLIA, the nearest rail station and highway, and whether it sits inside a gazetted industrial zone.
One correction worth flagging, because it changes every PSF figure: the source areas are recorded in square metres. We convert to square feet (×10.764) before computing price per square foot — so “PSF” here genuinely means per square foot, the unit the market quotes.
The model
We train a gradient-boosted decision-tree model (LightGBM) to predict the log of transacted price from those features, then translate back to ringgit.
- Honest validation: we split the data by time — training on earlier deals and testing on later ones the model has never seen — so the accuracy figure reflects real forecasting, not memorisation.
- Accuracy: the model values held-out deals to a median error of about 12%. Half of all unseen properties are valued within ~12% of their actual transacted price.
- Local context: features like recent mukim-level price levels, transaction volume and comparable-sale signals let the model adapt to each locality rather than applying one Valley-wide rule.
A model that values a property to a median error of ~12% isn't a replacement for a valuer or a broker's read — it's a fast, consistent, unbiased second opinion across tens of thousands of deals at once.
How we rank “what drives price”
To turn the model into the driver rankings used across this series, we apply SHAP — a method that attributes each property's predicted price across its features, so we can measure how many ringgit each factor moves a typical deal.
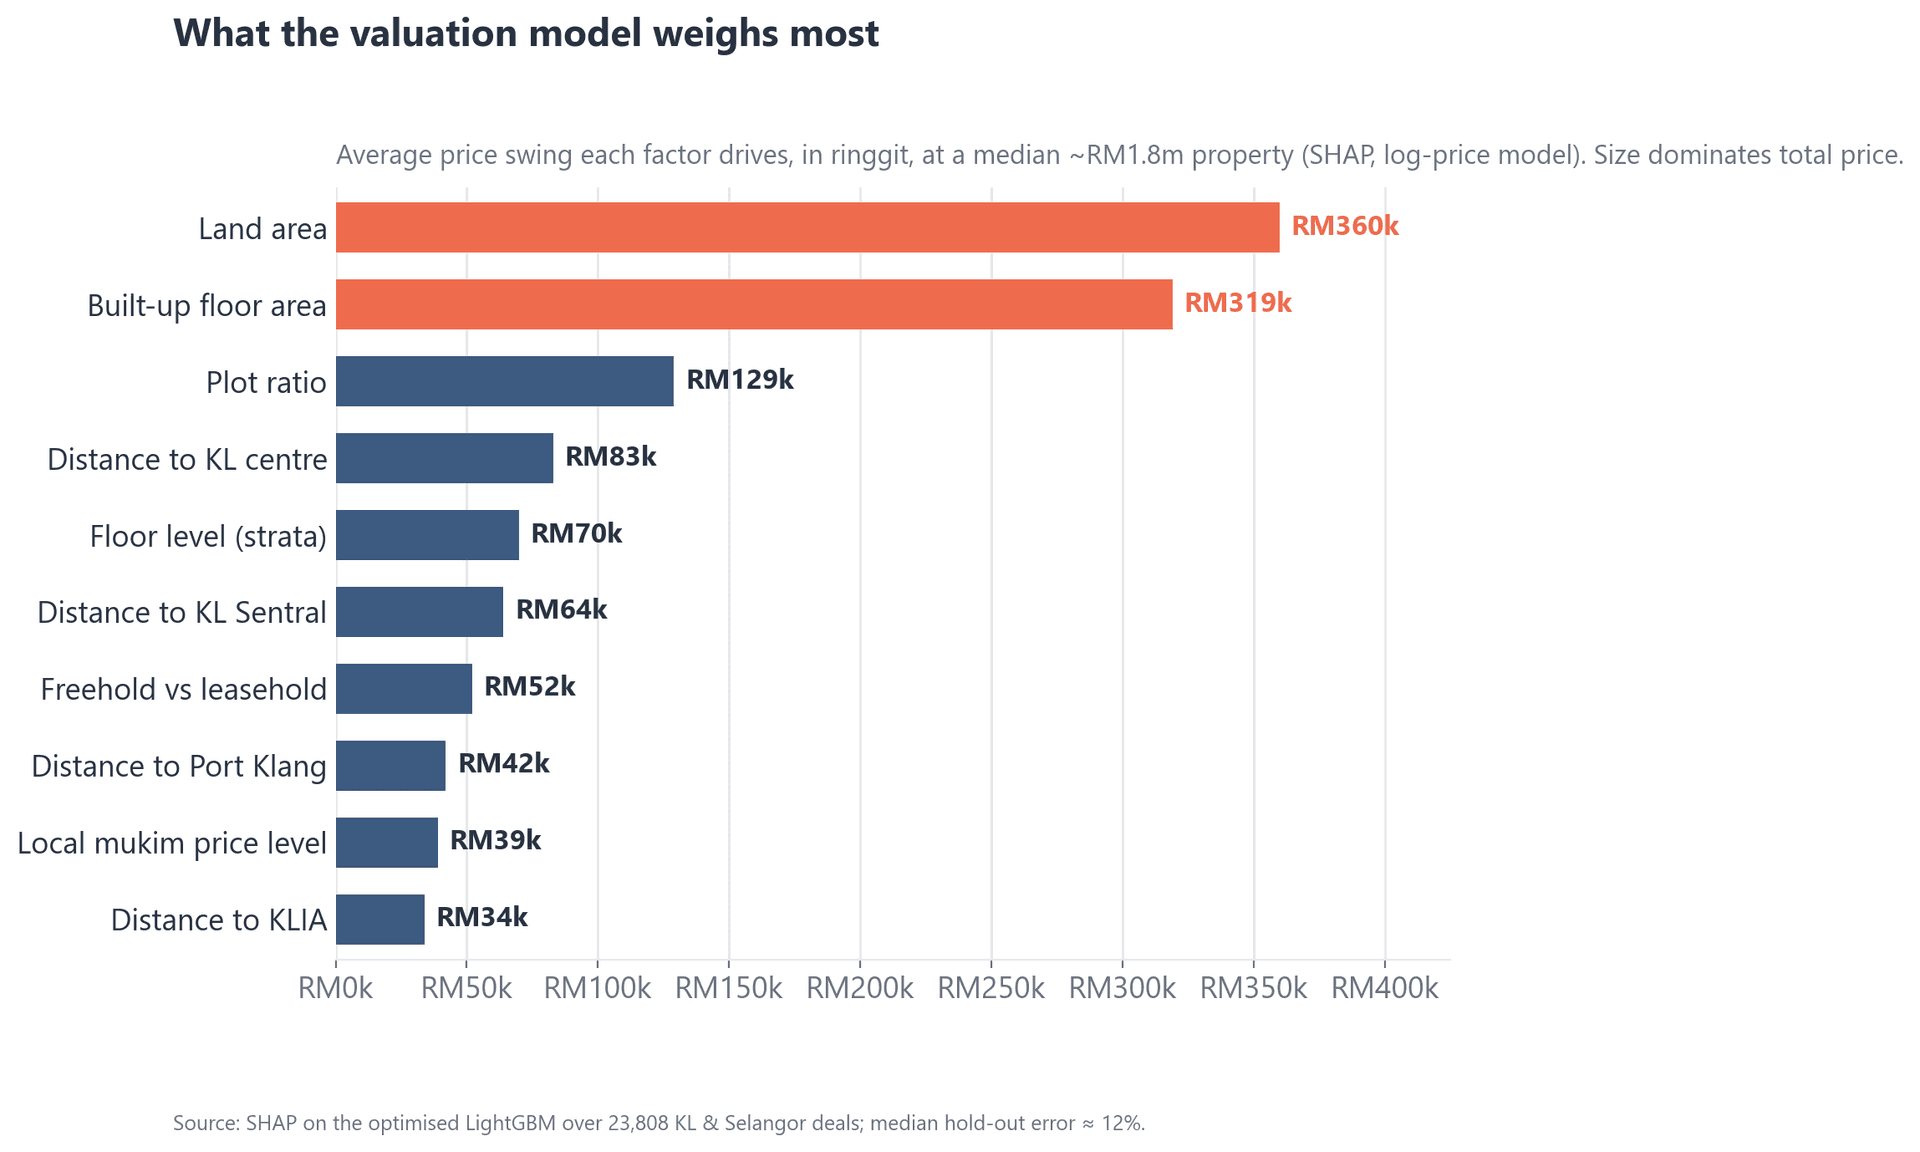
The headline: size dominates total price (land + floor area ≈ three-quarters of it), which is exactly why the rest of the series measures everything per square foot — to strip size out and see what's left. Once you do, location, tenure and local market context are where the interesting differences live.
| Factor | Avg. swing on a typical deal |
|---|---|
| Land area | ~RM360k |
| Built-up floor area | ~RM319k |
| Plot ratio (floor ÷ land) | ~RM129k |
| Distance to KL city centre | ~RM83k |
| Floor level (strata) | ~RM70k |
| Distance to KL Sentral | ~RM64k |
| Freehold vs leasehold | ~RM52k |
| Distance to Port Klang | ~RM42k |
| Local mukim price level | ~RM39k |
| Distance to KLIA | ~RM34k |
(Swings are measured on the log-price model at a median ~RM1.8m property; they show relative weight, not additive adjustments.)
Limitations, stated plainly
We'd rather you trust the honest version:
- Built-up deals, not vacant land. The set is built factory/warehouse and commercial transactions. Land values are implied, not raw land sales.
- Thin subtypes are noisier. Strata “industrial units” (n≈82) and small mukim/momentum cells carry more uncertainty; we flag these where they appear.
- Historical, not a forecast. The model explains how deals priced; any forward-looking statement (2026 outlook, momentum) is informed expectation, not measurement. (Trend caveats →)
- Medians, not appraisals. District/subtype figures are medians for orientation; a specific title turns on frontage, zoning, plot ratio, lease tenor and condition.
- Conflict of interest, disclosed. One of us brokers in this market. We publish the method precisely so the analysis stands on its own.
Frequently asked questions
How accurate is the valuation model?
It values held-out deals (ones it never trained on) to a median error of about 12% — half of all unseen properties within ~12% of their actual transacted price — validated on a time-based split so it reflects forecasting, not memorisation.
What data is it based on?
23,808 transacted commercial and industrial deals across Kuala Lumpur and Selangor, April 2021 to September 2025 — actual prices at transaction, enriched with location, size, tenure and local-market features.
Can a model replace a valuer or agent?
No. It's a fast, consistent second opinion across the whole market at once. Specific deals still turn on frontage, zoning, lease terms and condition — judgement a model doesn't see.
About the authors
This series is by Jay Kew — an industrial property agent in the Klang Valley who brokers factory, warehouse and land deals across KL and Selangor — and Jasper Wu, the data scientist who builds the valuation models behind it. Connect: Jasper on LinkedIn.
Disclosure: Jay is a practising agent with a commercial interest in this market; every figure in this series comes from transacted-price data and the method above, so you can check the reasoning rather than take our word for it.
More in this series: What moves industrial prices (pillar) · The price map by area · Factory subtypes & PSF · The Port Klang myth · Industrial land value · Freehold vs leasehold · Did prices fall? · Where it's heating up