Market Intelligence / Data Analysis
Did Klang Valley Industrial Prices Fall? Why the Median Lies (2021–2025)
Pull the median transacted price for Klang Valley industrial and you'll see a scary line: RM2.9m in 2021 down to RM1.5m in 2025 — about −48%. A crash, apparently.
It isn't. Measure the same market per square foot and value is essentially flat. The “fall” is almost entirely a change in what transacted, not a drop in what property is worth. If you make a buy/sell decision off the headline median, you'll be reacting to a statistical illusion. (Method →)
Two lines, two completely different stories
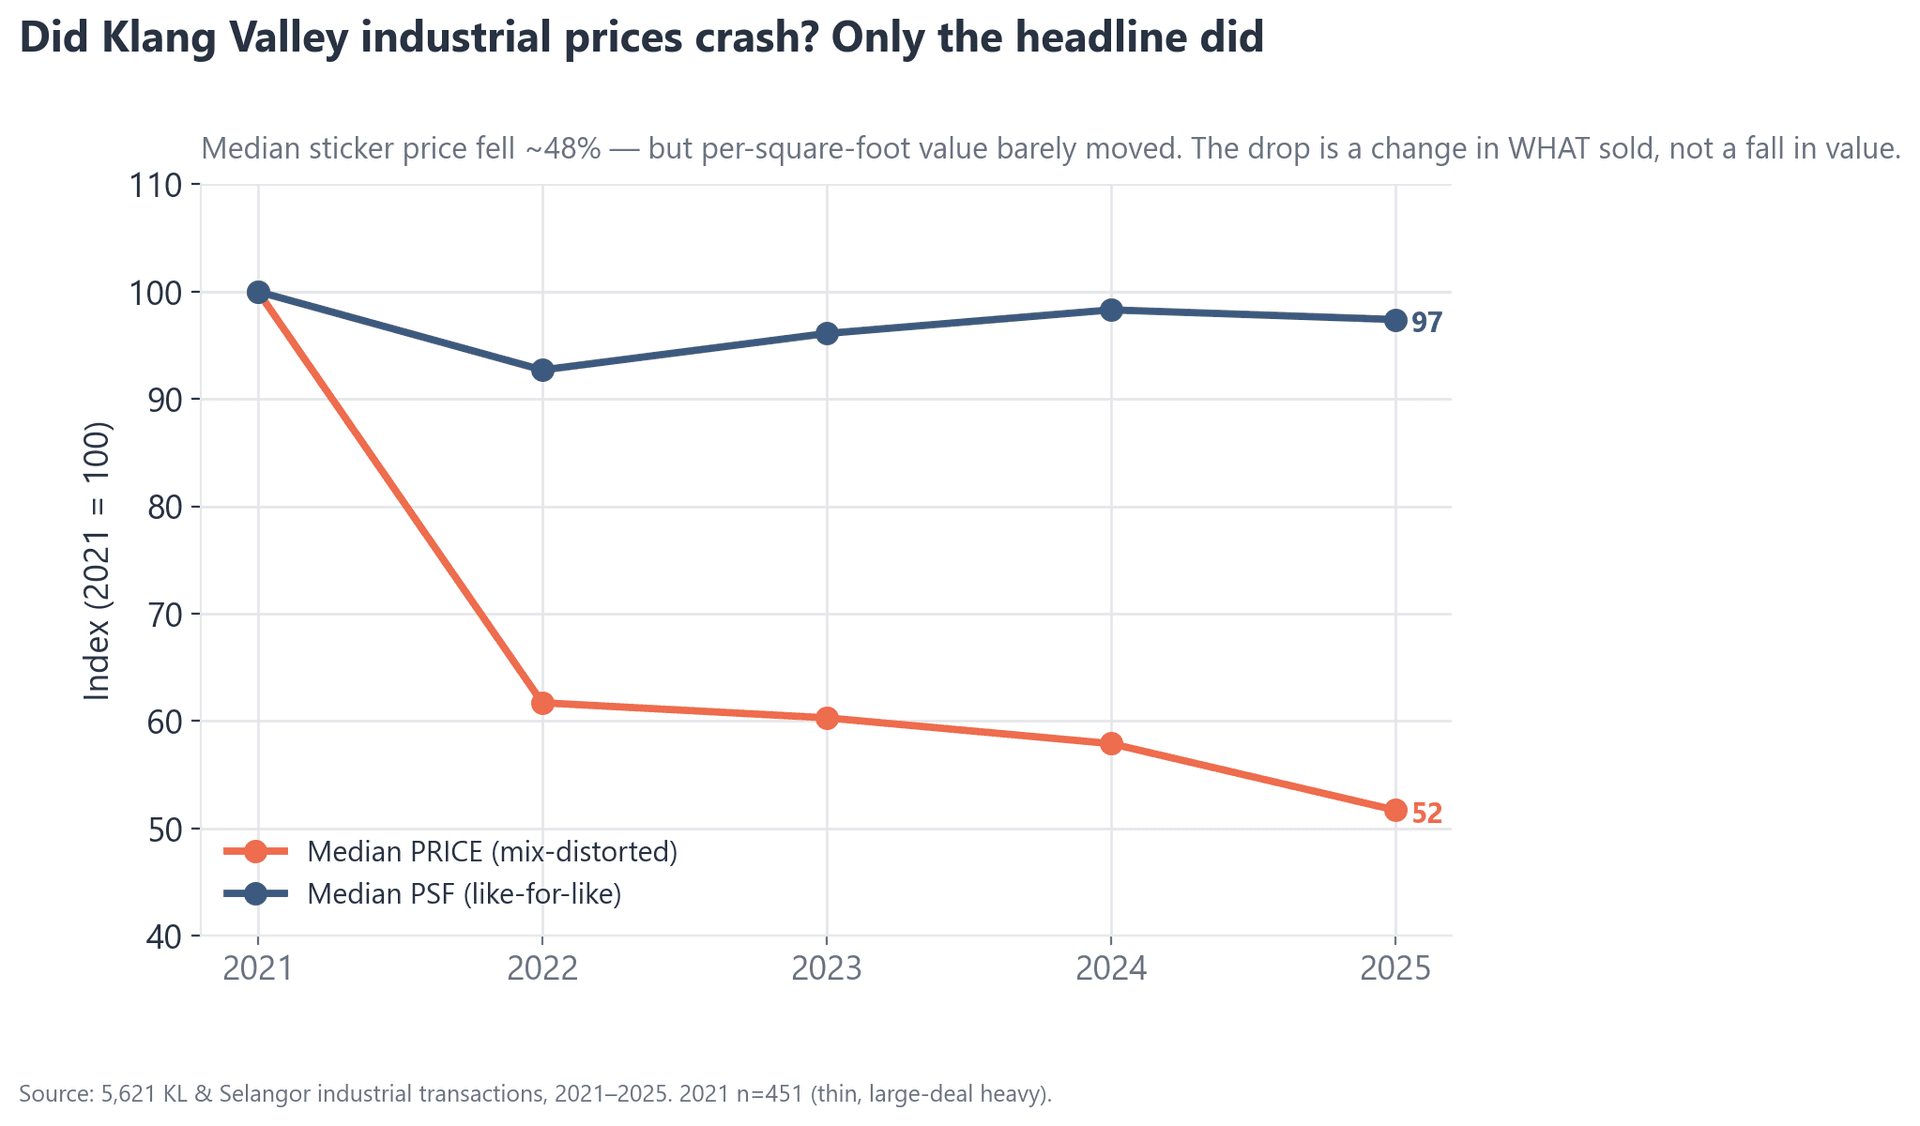
| Year | Median price | Median PSF | Price index | PSF index |
|---|---|---|---|---|
| 2021 | RM2.90m | RM557 | 100 | 100 |
| 2022 | RM1.79m | RM516 | 62 | 93 |
| 2023 | RM1.75m | RM535 | 60 | 96 |
| 2024 | RM1.68m | RM547 | 58 | 98 |
| 2025 | RM1.50m | RM542 | 52 | 97 |
Headline price: −48%. Per-square-foot value: about −3% — flat, within noise. Same deals, same period, opposite conclusions.
What actually happened: the mix changed
The median is just “the middle deal.” If the kind of property in the middle changes, the median moves even when nothing gets cheaper.
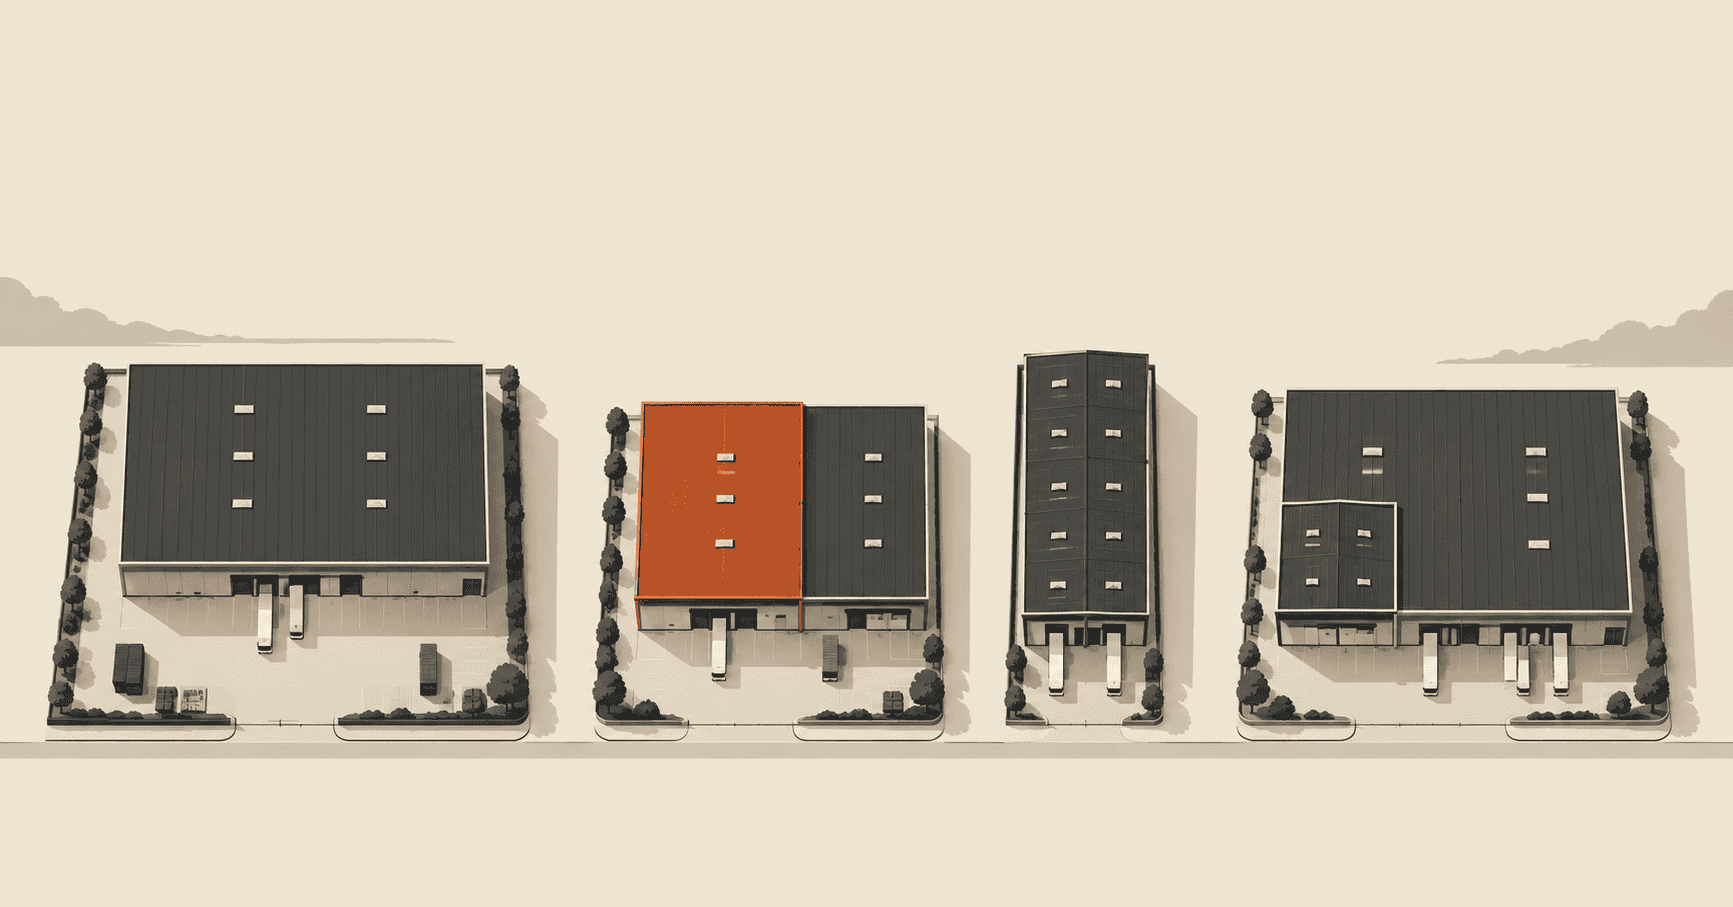
That's exactly what happened. 2021 was a thin, top-heavy year (only 451 industrial deals, skewed toward large detached factories with big sticker prices). As volume normalised through 2022–2025, far more affordable terraced units and strata lots transacted — pulling the middle deal down to a smaller, cheaper property, even as the price of any given square foot held firm.
So the median didn't measure falling value. It measured a shift in the shopping basket — more small boxes, fewer big ones.
This is the same trap as "leasehold looks dearer": a composition effect wearing a price-effect costume. The fix is always the same — normalise. Compare per square foot, not per deal. (See the leasehold example →)
So are prices rising, falling, or flat?
On a like-for-like, per-square-foot basis, the honest answer for 2021–2025 is broadly flat — PSF dipped slightly in 2022 and has edged back since, with no sign of a real-value crash. Momentum differs by area, so read your own district on the price map by area.
This is measured history, not a forecast. The measured fact is the flat PSF line above.
2021's small sample (n=451) makes it a shaky baseline; the 2022→2025 PSF path is the more reliable read, and it's flat-to-firm.
Caveat
Frequently asked questions
Did industrial property prices fall in the Klang Valley?
The median sticker price fell about 48% from 2021 to 2025, but price per square foot was essentially flat (~−3%). The headline drop reflects a change in what transacted — more small terraced and strata units — not a fall in underlying value.
Why did the median price drop so much if values didn't?
Because the median tracks the “middle deal,” and the middle deal got smaller and cheaper as volume shifted toward affordable units. It's a composition (mix) effect, not a price effect. Per-square-foot value is the honest measure.
Are Klang Valley industrial prices going up in 2026?
From 2021 to 2025 the median price per square foot held at about RM540 to RM550 after a small dip in 2022. That is history, not a forecast: the data shows stability, not a boom. Read PSF, not headline medians.
About the authors
This series is by Jay Kew — an industrial property agent in the Klang Valley who brokers factory, warehouse and land deals across KL and Selangor — and Jasper Wu, the data scientist who builds the valuation models behind it. Connect: Jasper on LinkedIn.
Disclosure: Jay is a practising agent with a commercial interest in this market; every figure here comes from transacted-price data and a documented method.
More in this series: What moves industrial prices (pillar) · The price map by area · How we value it