Kota Elmina Industrial Property Prices (2026)
A factory in Kota Elmina typically sells for RM 956 per sq ft of floor space, based on 73 sales from 2021 to 2026. That is 31% more than the typical factory in Shah Alam, and 135% more than across Malaysia.
- Kota ElminaRM 956
- Shah AlamRM 731
- MalaysiaRM 407
- Typical sale priceRM 8.1M
- Sales recorded73
- PeriodJan 2021 to May 2026
- Freehold100% of sales
What does "typical" mean here?
Line up every sale from cheapest to most expensive and take the one in the middle: half sold for more, half for less. Unlike an average, one RM 40 million mega-deal cannot drag it up.
Prices by factory type in Kota Elmina
| Factory type | Sales | Typical price | Typical per sq ft |
|---|---|---|---|
| Semi-D factory | 73 | RM 8.1M | RM 956 |
Types with fewer than 10 sales are left out, because a handful of deals can swing the figure.
Freehold or leasehold in Kota Elmina
- FreeholdRM 956 per sq ft, 73 sales
Land value in Kota Elmina
Price per sq ft of land: RM 353. The sale price divided by the land area, so it includes the building.
Compare Shah Alam estates
Orange line: Shah Alam typical, RM 731. Dashed line: Malaysia typical, RM 407.
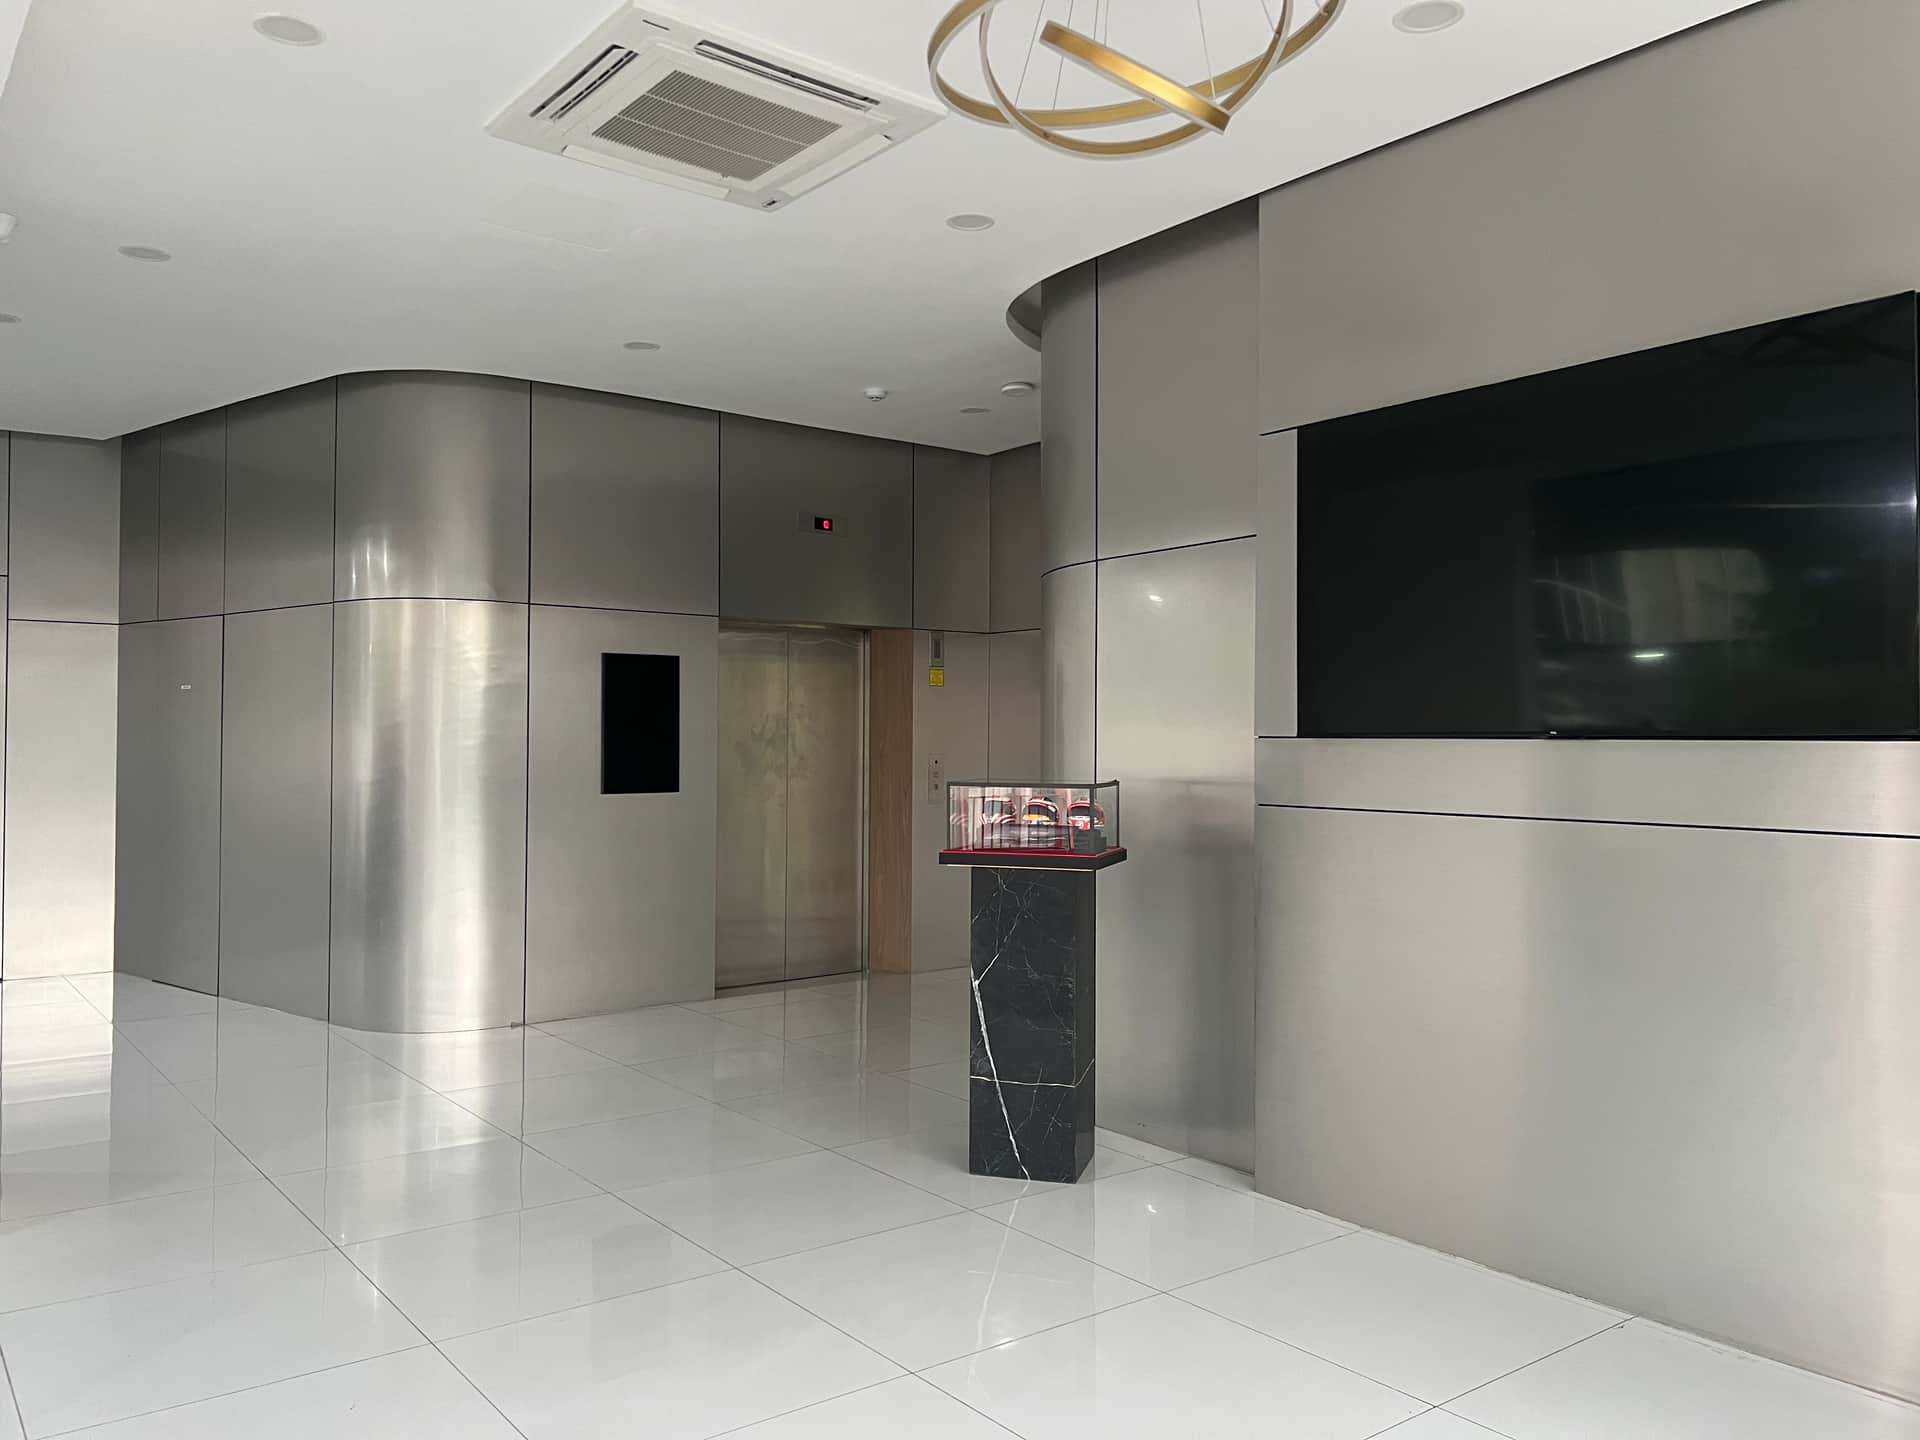
Shah Alam Hi-Tech Semi-D Factory for Sale | 400A Power, Corner Lot
Shah Alam, Selangor
Northport (Port Klang) · 26 km
Built-up
12,556 sqft
Land
14,466 sqft
Power
400 Amps
RM 15,000,000
RM 1194.65 / sqft
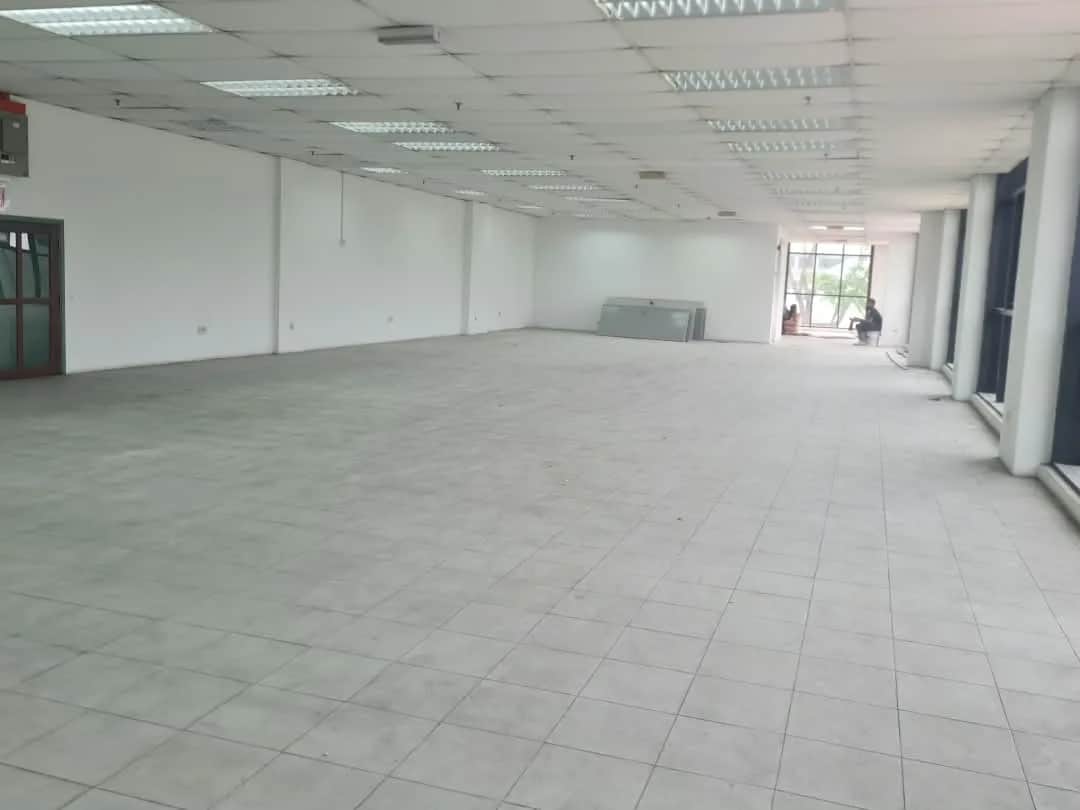
2-Storey Detached Factory For Sale @ Hicom Glenmarie
Hicom-Glenmarie Industrial Park, Selangor
Northport (Port Klang) · 20 km
Built-up
33,000 sqft
Land
1.38 acres
Power
400 Amps
RM 28,000,000
RM 848.48 / sqft
Selling a factory in Kota Elmina?
Jay Kew (REN57969) checks your price against the sales on this page and the factories listed nearby. Free.
Questions about Kota Elmina factory prices
What is the average factory price per sq ft in Kota Elmina?
The typical factory in Kota Elmina sold for RM 956 per sq ft of floor space from 2021 to 2026, based on 73 sales.
How much is industrial land worth in Kota Elmina?
Factory sales in Kota Elmina work out at about RM 353 per sq ft of land, based on 73 sales of landed factories. That figure divides the sale price by the land area, so it includes the building.
How these figures are worked out
Source: NAPIC Open Sales Data, sales recorded from January 2021 to May 2026. "Typical" is the median: half of the sales were higher, half lower. "Half of sales between" is the 25th to 75th percentile. We leave out sales under RM 50 or over RM 5,000 per sq ft, and landed sales whose recorded floor space is under a fifth of the land (usually the office floor only). Strata units use their unit area. A place needs 30 sales for a page, a type 10 sales for a row and a year 20 sales for a bar. NAPIC adds late sales for months, so the latest year is incomplete. Last updated 10 October 2026. Figures prepared by Jasper Wu (data) and Jay Kew, REN57969.