Kapar Industrial Property Prices (2026)
A factory in Kapar typically sells for RM 488 per sq ft of floor space, based on 508 sales from 2021 to 2026. That is 6% less than the typical factory in Selangor, and 20% more than across Malaysia.
Before you buy or sell in Kapar
- A semi-D factory costs about RM 280 more per sq ft than a terrace factory here.
- Freehold factories sold for more, RM 507 per sq ft against RM 263 for leasehold, and 94% of sales here were freehold.
- SelangorRM 517
- KaparRM 488
- MalaysiaRM 407
- Typical sale priceRM 2.3M
- Sales recorded508
- PeriodMar 2021 to Jun 2026
- Freehold94% of sales
What does "typical" mean here?
Line up every sale from cheapest to most expensive and take the one in the middle: half sold for more, half for less. Unlike an average, one RM 40 million mega-deal cannot drag it up.
Prices by factory type in Kapar
| Factory type | Sales | Typical price | Typical per sq ft |
|---|---|---|---|
| Terrace factory | 231 | RM 650,000 | RM 340 |
| Semi-D factory | 195 | RM 3.8M | RM 617 |
| Detached factory | 77 | RM 7.4M | RM 664 |
Types with fewer than 10 sales are left out, because a handful of deals can swing the figure.
Price per sq ft by year in Kapar
| Year | Typical per sq ft | Sales |
|---|---|---|
| 2021 | RM 614 | 49 |
| 2022 | RM 500 | 150 |
| 2023 | RM 461 | 131 |
| 2024 | RM 513 | 113 |
| 2025 | RM 542 | 47 |
Freehold or leasehold in Kapar
- FreeholdRM 507 per sq ft, 480 sales
- LeaseholdRM 263 per sq ft, 28 sales
Freehold factories sold for more, RM 507 per sq ft against RM 263 for leasehold, and 94% of sales here were freehold.
Land value in Kapar
Price per sq ft of land: RM 309. The sale price divided by the land area, so it includes the building.
Industrial estates in Kapar
Compare Selangor areas
- DamansaraRM 792138 sales138
- SelayangRM 748174 sales174
- Shah AlamRM 731438 sales438
- KepongRM 681122 sales122
- PuchongRM 654407 sales407
- Petaling JayaRM 65082 sales82
- AmpangRM 63168 sales68
- DengkilRM 618187 sales187
- BalakongRM 582275 sales275
- KundangRM 56733 sales33
- Sungai BulohRM 557171 sales171
- CherasRM 55666 sales66
- KajangRM 536224 sales224
- BantingRM 53175 sales75
- Subang JayaRM 510472 sales472
- Puncak AlamRM 49065 sales65
- KaparRM 488508 sales508
- SemenyihRM 474370 sales370
- RawangRM 447175 sales175
- Telok Panglima GarangRM 39859 sales59
- KlangRM 378264 sales264
- Port KlangRM 346134 sales134
- SerendahRM 116668 sales668
Orange line: Selangor typical, RM 517. Dashed line: Malaysia typical, RM 407.
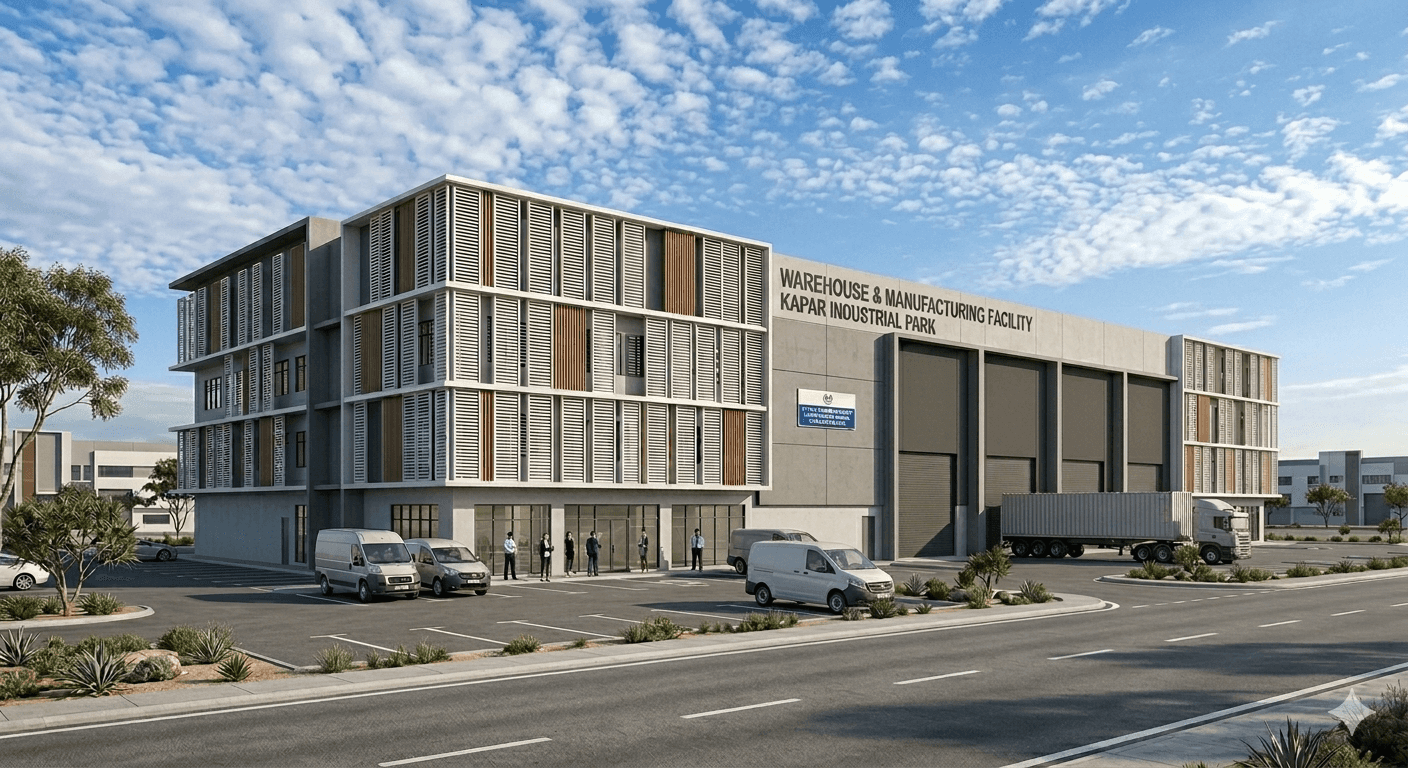
Detached Factory for Sale in Bukit Raja, Klang (Near Port Klang)
Kapar Industrial Park (KIIP), Selangor
Built-up
23,369 sqft
Land
36,102 sqft
Power
400 Amps
RM 14,076,110
RM 602.34 / sqft
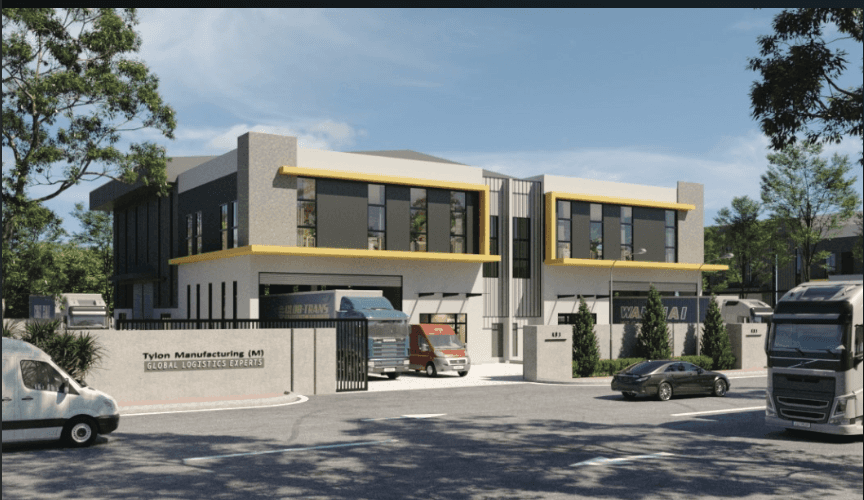
Semi-Detached Factory for Sale in Bukit Raja, Klang (Near WCE & Port Klang)
Kapar Industrial Park (KIIP), Selangor
Built-up
11,447 sqft
Land
19,601 sqft
Power
200 Amps
RM 7,516,890
RM 656.67 / sqft
Selling a factory in Kapar?
Jay Kew (REN57969) checks your price against the sales on this page and the factories listed nearby. Free.
Questions about Kapar factory prices
What is the average factory price per sq ft in Kapar?
The typical factory in Kapar sold for RM 488 per sq ft of floor space from 2021 to 2026, based on 508 sales.
How much is industrial land worth in Kapar?
Factory sales in Kapar work out at about RM 309 per sq ft of land, based on 503 sales of landed factories. That figure divides the sale price by the land area, so it includes the building.
Is freehold more expensive than leasehold in Kapar?
Freehold factories sold for more, RM 507 per sq ft against RM 263 for leasehold, and 94% of sales here were freehold.
How these figures are worked out
Source: NAPIC Open Sales Data, sales recorded from March 2021 to June 2026. "Typical" is the median: half of the sales were higher, half lower. "Half of sales between" is the 25th to 75th percentile. We leave out sales under RM 50 or over RM 5,000 per sq ft, and landed sales whose recorded floor space is under a fifth of the land (usually the office floor only). Strata units use their unit area. A place needs 30 sales for a page, a type 10 sales for a row and a year 20 sales for a bar. NAPIC adds late sales for months, so the latest year is incomplete. Last updated 10 October 2026. Figures prepared by Jasper Wu (data) and Jay Kew, REN57969.